DSS Bressertdouble smoothed stochastic (Double Smoothed Stochastic Indicator by Walter Bressert)

0
(0)
नाम:
DSS Bressert - double smoothed stochastic (Double Smoothed Stochastic Indicator by Walter Bressert) [ आरयू ]
लेखक: MetaQuotes (2008.08.13 09:51)
डाउनलोड: 9678
डाउनलोड करना:
DSS Bressert.mq4 (3.1 केबी) देखना
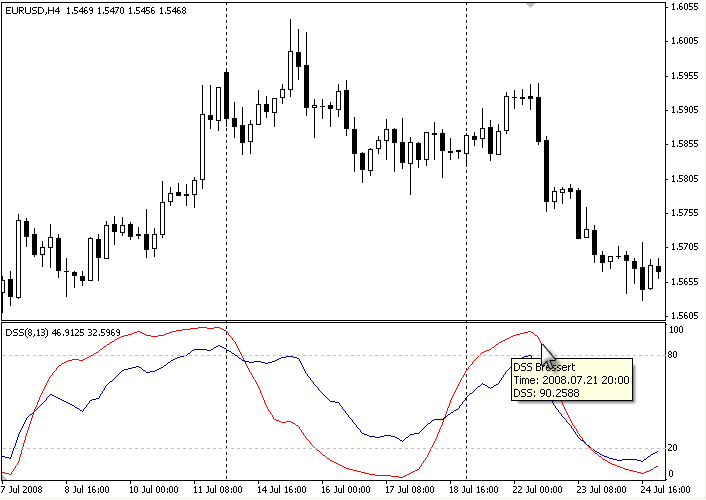
Its calculation algorithm is very similar to that of stochastic indicator. The value above 80 signifies the overbuying, the value below 20 signifies the overselling.

DSS Bressert - double smoothed stochastic (Double Smoothed Stochastic Indicator by Walter Bressert) 2


The formula for the calculation is taken from the website एचटीटीपी://www.tradesignalonline.com/Lexicon/Default.aspx?name=DSS%3A+Double+Smoothed+Stochastics+(Bressert)

विवरण
One after the other, William Blau and Walter Bressert each presented a version of the Double Smoothed Stochastics. Two exponentially smoothed MAs are used to even out the input values (एच, L and C), in a similar way to the well-known stochastic formula.

Calculation
Calculation of the DSS indicator according to Bressert is similar to stochastics.
1.) The numerator: first the difference between the current close and the period low is formed. The denominator: here the difference between the period high minus the period low is calculated. Now the quotient of numerator and denominator is calculated, exponentially smoothed and then multiplied by 100.
2.) The method is analogous to 1.) with the distinction that now the prices of the newly calculated price series of 1.) प्रयोग किया जाता है.

DSS Bressert - double smoothed stochastic (Double Smoothed Stochastic Indicator by Walter Bressert) 3

पैरामीटर
The adjustable period length can be chosen from 2 को 500. The most common settings will have a period length ranging from 5 को 30. इसके साथ ही, the indicator can be smoothed in the interval from 1 को 50. Meaningful smoothing values lie in the short-term range.

Interpretation
The application of the DSS is comparable with that of the stochastic method. इसलिए, values above 70 या 80 must be regarded as overbought and values below 20 या 30 as oversold. A rise of the DSS above its center line should be viewed as bullish, and a fall of the DSS below its center line as bearish.
ये पोस्ट कितनी उपयोगी थी?

इसे रेट करने के लिए किसी स्टार पर क्लिक करें!

औसत श्रेणी 0 / 5. वोटों की गिनती: 0

अभी तक कोई वोट नहीं! इस पोस्ट को रेट करने वाले पहले व्यक्ति बनें.

हमें खेद है कि यह पोस्ट आपके लिए उपयोगी नहीं रही!

आइए इस पोस्ट को बेहतर बनाएं!

हमें बताएं कि हम इस पोस्ट को कैसे बेहतर बना सकते हैं?


लेखक: विदेशी मुद्रा विकी टीम
हम अत्यधिक अनुभवी विदेशी मुद्रा व्यापारियों की एक टीम हैं [2000-2023] जो अपनी शर्तों पर जीवन जीने के लिए समर्पित हैं. हमारा प्राथमिक उद्देश्य वित्तीय स्वतंत्रता और स्वतंत्रता प्राप्त करना है, और हमने स्व-शिक्षा का अनुसरण किया है और एक स्व-टिकाऊ जीवन शैली प्राप्त करने के हमारे साधन के रूप में विदेशी मुद्रा बाजार में व्यापक अनुभव प्राप्त किया है।.