- 8月 18, 2014
- 投稿者: 外国為替ウィキチーム
- カテゴリー: 無料外国為替EA
コメントはありません
1629
1499
チェーンプライスRSI - メタトレーダーのインジケーター 4
- ビュー:
- 836
- 評価:
-
投票: 2
説明:
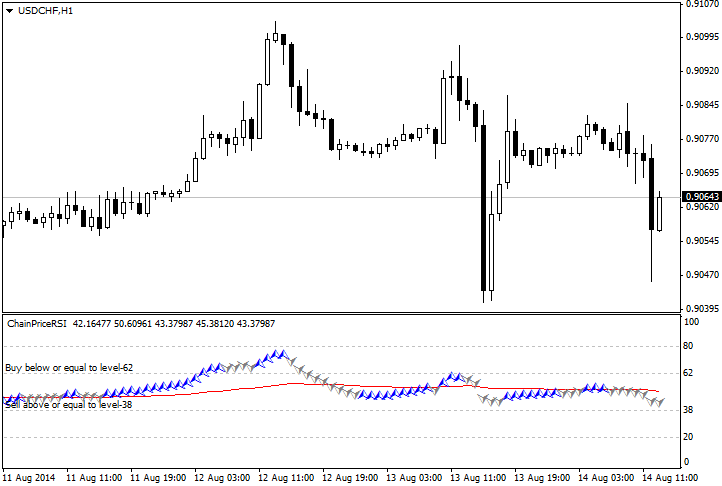
Forex indicator ChainPriceRSI is based on the RSI と MA 指標.
チェーンプライス RSI は、注文をオープンする方向を示すトレンドライン矢印のインジケーターです.
How to use ChainPriceRSI indicator:
- Blue Arrow, Buy = when the Arrow below level 62;
- White Arrow, Sell = when Arrow above level 38;
- 売る, when Arrow Blue, touching or passing level of 80, the price will get back down;
- 買う, when Arrow Blue, touching or passing level of 20, the price will soon turn up;
- If Arrow passing trend line (red line), from bottom to top, the price must go up, and if the Arrow over the trend line, from top to bottom, the price must fall. 言い換えると, must still follow the trend line (red line).
画像:


